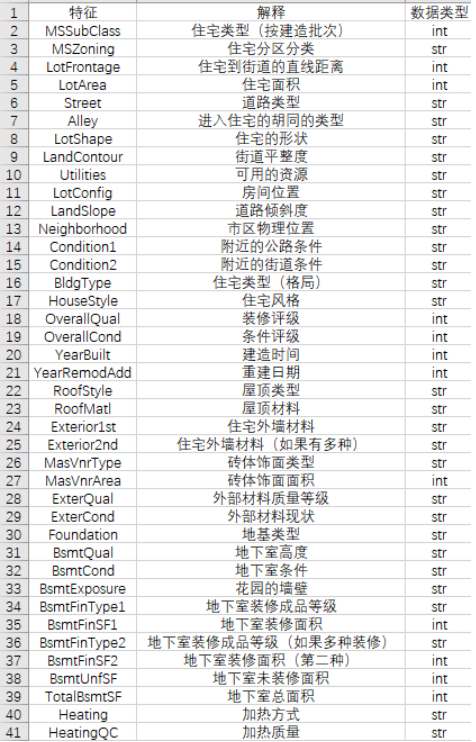
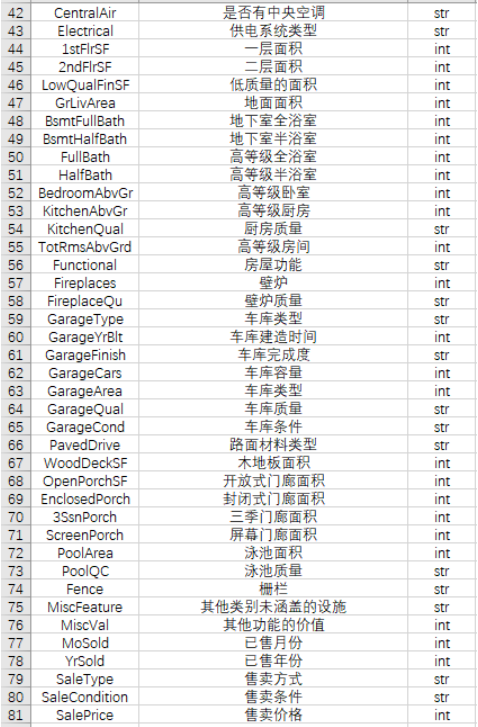
一、采集数据 1、导入数据分析数据格式 1 2 3 4 5 6 import numpy as npimport pandas as pdimport matplotlib.pyplot as pltimport seaborn as snsimport warningsfrom sklearn.preprocessing import StandardScaler
1 2 3 4 5 6 7 train_path = 'train.csv' train_data = pd.read_csv(train_path) train_data = train_data.drop('Id' , axis=1 ) test_path = 'test.csv' test_data = pd.read_csv(test_path) test_data = test_data.drop('Id' , axis=1 ) test_data
MSSubClass
MSZoning
LotFrontage
LotArea
Street
Alley
LotShape
LandContour
Utilities
LotConfig
...
ScreenPorch
PoolArea
PoolQC
Fence
MiscFeature
MiscVal
MoSold
YrSold
SaleType
SaleCondition
0
20
RH
80.0
11622
Pave
NaN
Reg
Lvl
AllPub
Inside
...
120
0
NaN
MnPrv
NaN
0
6
2010
WD
Normal
1
20
RL
81.0
14267
Pave
NaN
IR1
Lvl
AllPub
Corner
...
0
0
NaN
NaN
Gar2
12500
6
2010
WD
Normal
2
60
RL
74.0
13830
Pave
NaN
IR1
Lvl
AllPub
Inside
...
0
0
NaN
MnPrv
NaN
0
3
2010
WD
Normal
3
60
RL
78.0
9978
Pave
NaN
IR1
Lvl
AllPub
Inside
...
0
0
NaN
NaN
NaN
0
6
2010
WD
Normal
4
120
RL
43.0
5005
Pave
NaN
IR1
HLS
AllPub
Inside
...
144
0
NaN
NaN
NaN
0
1
2010
WD
Normal
...
...
...
...
...
...
...
...
...
...
...
...
...
...
...
...
...
...
...
...
...
...
1454
160
RM
21.0
1936
Pave
NaN
Reg
Lvl
AllPub
Inside
...
0
0
NaN
NaN
NaN
0
6
2006
WD
Normal
1455
160
RM
21.0
1894
Pave
NaN
Reg
Lvl
AllPub
Inside
...
0
0
NaN
NaN
NaN
0
4
2006
WD
Abnorml
1456
20
RL
160.0
20000
Pave
NaN
Reg
Lvl
AllPub
Inside
...
0
0
NaN
NaN
NaN
0
9
2006
WD
Abnorml
1457
85
RL
62.0
10441
Pave
NaN
Reg
Lvl
AllPub
Inside
...
0
0
NaN
MnPrv
Shed
700
7
2006
WD
Normal
1458
60
RL
74.0
9627
Pave
NaN
Reg
Lvl
AllPub
Inside
...
0
0
NaN
NaN
NaN
0
11
2006
WD
Normal
1459 rows × 79 columns
1 2 3 tmp3 =train_data.isnull().sum () tmp3[tmp3>0 ].sort_values(ascending=False )
1 2 3 4 5 6 7 8 9 10 11 12 13 14 15 16 17 18 19 20 PoolQC 1453 MiscFeature 1406 Alley 1369 Fence 1179 FireplaceQu 690 LotFrontage 259 GarageYrBlt 81 GarageType 81 GarageFinish 81 GarageQual 81 GarageCond 81 BsmtFinType2 38 BsmtExposure 38 BsmtFinType1 37 BsmtCond 37 BsmtQual 37 MasVnrArea 8 MasVnrType 8 Electrical 1 dtype: int64
2、理解数据
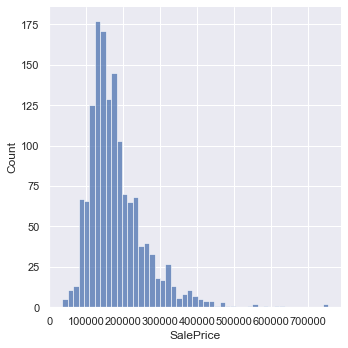
二、探索性可视化 2.1 售价 1 train_data['SalePrice' ].describe()
1 2 3 4 5 6 7 8 9 count 1460.000000 mean 180921.195890 std 79442.502883 min 34900.000000 25% 129975.000000 50% 163000.000000 75% 214000.000000 max 755000.000000 Name: SalePrice, dtype: float64
通过观察,SalePrice没有无效或者非数值数据
1 2 3 plt.figure(figsize = (12 , 8 )) sns.displot(train_data['SalePrice' ])
1 <seaborn.axisgrid.FacetGrid at 0x1ece6c52e50>
1 <Figure size 864x576 with 0 Axes>
2.2 售价与房屋面积 1 2 3 4 5 6 7 sns.relplot('LotArea' , 'SalePrice' , data=train_data, kind='scatter' )
1 <seaborn.axisgrid.FacetGrid at 0x1ece819e7c0>
2.3 售价与建造时间 1 2 3 plt.figure(figsize=(12 , 8 )) sns.boxplot(train_data['YearBuilt' ], train_data['SalePrice' ]) plt.show()
2.4 售价与地理位置 1 2 3 4 5 g = sns.catplot('Neighborhood' , 'SalePrice' , data=train_data, kind='strip' ) g.fig.set_size_inches(12 , 8 ) plt.show()
1 2 3 g = sns.catplot('Neighborhood' , 'SalePrice' , data=train_data, kind='point' ) g.fig.set_size_inches(12 , 8 ) plt.show()
1 2 3 g = sns.catplot('Neighborhood' , 'SalePrice' , data=train_data, kind='bar' ) g.fig.set_size_inches(12 , 8 ) plt.show()
1 2 3 g = sns.catplot('Neighborhood' , 'SalePrice' , data=train_data, kind='box' ) g.fig.set_size_inches(12 , 8 ) plt.show()
2.5 售价与装修评级 1 2 3 g = sns.catplot('OverallQual' , 'SalePrice' , data=train_data, kind='box' ) g.fig.set_size_inches(12 , 8 ) plt.show()
三、特征提取 1 2 3 4 5 plt.figure(figsize=(12 , 8 )) corrmat = train_data.corr() sns.heatmap(corrmat, annot=False , vmax=1 , vmin=-1 ) plt.show() corrmat['SalePrice' ].sort_values(ascending=False )
1 2 3 4 5 6 7 8 9 10 11 12 13 14 15 16 17 18 19 20 21 22 23 24 25 26 27 28 29 30 31 32 33 34 35 36 37 38 SalePrice 1.000000 OverallQual 0.790982 GrLivArea 0.708624 GarageCars 0.640409 GarageArea 0.623431 TotalBsmtSF 0.613581 1stFlrSF 0.605852 FullBath 0.560664 TotRmsAbvGrd 0.533723 YearBuilt 0.522897 YearRemodAdd 0.507101 GarageYrBlt 0.486362 MasVnrArea 0.477493 Fireplaces 0.466929 BsmtFinSF1 0.386420 LotFrontage 0.351799 WoodDeckSF 0.324413 2ndFlrSF 0.319334 OpenPorchSF 0.315856 HalfBath 0.284108 LotArea 0.263843 BsmtFullBath 0.227122 BsmtUnfSF 0.214479 BedroomAbvGr 0.168213 ScreenPorch 0.111447 PoolArea 0.092404 MoSold 0.046432 3SsnPorch 0.044584 BsmtFinSF2 -0.011378 BsmtHalfBath -0.016844 MiscVal -0.021190 LowQualFinSF -0.025606 YrSold -0.028923 OverallCond -0.077856 MSSubClass -0.084284 EnclosedPorch -0.128578 KitchenAbvGr -0.135907 Name: SalePrice, dtype: float64
1 2 3 4 5 plt.figure(figsize=(12 , 8 )) SPcorrmat = train_data.corr()[u'SalePrice' ] SPcorrmat = SPcorrmat.sort_values(key=abs , ascending=False ) plt.plot(SPcorrmat.head(10 ))
1 [<matplotlib.lines.Line2D at 0x1ecf2abffa0>]
取与SalePrice相关性较大的几个特征,暂时先取6个。
数据清洗 1 2 3 path = 'extracted_data.csv' data = pd.read_csv(path) data
OverallQual
GrLivArea
GarageCars
GarageArea
TotalBsmtSF
1stFlrSF
SalePrice
0
7
1710
2
548
856
856
208500
1
6
1262
2
460
1262
1262
181500
2
7
1786
2
608
920
920
223500
3
7
1717
3
642
756
961
140000
4
8
2198
3
836
1145
1145
250000
...
...
...
...
...
...
...
...
1455
6
1647
2
460
953
953
175000
1456
6
2073
2
500
1542
2073
210000
1457
7
2340
1
252
1152
1188
266500
1458
5
1078
1
240
1078
1078
142125
1459
5
1256
1
276
1256
1256
147500
1460 rows × 7 columns
1 2 3 tmp = data.isnull().sum () tmp
1 2 3 4 5 6 7 8 OverallQual 0 GrLivArea 0 GarageCars 0 GarageArea 0 TotalBsmtSF 0 1stFlrSF 0 SalePrice 0 dtype: int64
特征归一化 1 2 3 4 sp = data.iloc[:, -1 ] data = (data - data.mean()) / data.std() data['SalePrice' ] = sp data
OverallQual
GrLivArea
GarageCars
GarageArea
TotalBsmtSF
1stFlrSF
SalePrice
0
0.651256
0.370207
0.311618
0.350880
-0.459145
-0.793162
208500
1
-0.071812
-0.482347
0.311618
-0.060710
0.466305
0.257052
181500
2
0.651256
0.514836
0.311618
0.631510
-0.313261
-0.627611
223500
3
0.651256
0.383528
1.649742
0.790533
-0.687089
-0.521555
140000
4
1.374324
1.298881
1.649742
1.697903
0.199611
-0.045596
250000
...
...
...
...
...
...
...
...
1455
-0.071812
0.250316
0.311618
-0.060710
-0.238040
-0.542249
175000
1456
-0.071812
1.061003
0.311618
0.126376
1.104547
2.354894
210000
1457
0.651256
1.569110
-1.026506
-1.033560
0.215567
0.065634
266500
1458
-0.794879
-0.832502
-1.026506
-1.089686
0.046889
-0.218907
142125
1459
-0.794879
-0.493765
-1.026506
-0.921308
0.452629
0.241532
147500
1460 rows × 7 columns
四、多变量线性回归模型 4.1 数据预处理 1 2 data.insert(0 , 'Ones' , 1 ) data
Ones
OverallQual
GrLivArea
GarageCars
GarageArea
TotalBsmtSF
1stFlrSF
SalePrice
0
1
0.651256
0.370207
0.311618
0.350880
-0.459145
-0.793162
208500
1
1
-0.071812
-0.482347
0.311618
-0.060710
0.466305
0.257052
181500
2
1
0.651256
0.514836
0.311618
0.631510
-0.313261
-0.627611
223500
3
1
0.651256
0.383528
1.649742
0.790533
-0.687089
-0.521555
140000
4
1
1.374324
1.298881
1.649742
1.697903
0.199611
-0.045596
250000
...
...
...
...
...
...
...
...
...
1455
1
-0.071812
0.250316
0.311618
-0.060710
-0.238040
-0.542249
175000
1456
1
-0.071812
1.061003
0.311618
0.126376
1.104547
2.354894
210000
1457
1
0.651256
1.569110
-1.026506
-1.033560
0.215567
0.065634
266500
1458
1
-0.794879
-0.832502
-1.026506
-1.089686
0.046889
-0.218907
142125
1459
1
-0.794879
-0.493765
-1.026506
-0.921308
0.452629
0.241532
147500
1460 rows × 8 columns
1 2 3 4 cols = data.shape[1 ] x = data.iloc[:, 0 :cols-1 ] y = data.iloc[:, cols-1 :cols]
1 2 3 4 x = np.matrix(x.values) y = np.matrix(y.values) theta = np.matrix(np.zeros(x.shape[1 ])) theta
1 matrix([[0., 0., 0., 0., 0., 0., 0.]])
4.2 线性回归 计算损失函数 1 2 3 def computeCost (X, y, theta ): inner = np.power((X * theta.T - y), 2 ) return np.sqrt(np.sum (inner) / (2 * len (X)))
梯度下降 1 2 3 4 5 6 7 8 9 10 11 12 13 14 15 16 def gradientDescent (x, y, theta, alpha, iters ): temp = np.matrix(np.zeros(theta.shape)) parameters = int (theta.ravel().shape[1 ]) cost = np.zeros(iters) for i in range (iters): error = (x * theta.T) - y for j in range (parameters): term = np.multiply(error, x[:, j]) temp[0 , j] = theta[0 , j] - ((alpha / len (x)) * np.sum (term)) theta = temp cost[i] = computeCost(x, y, theta) return theta, cost
1 2 g1, cost1 = gradientDescent(x, y, theta, 0.01 , 1500 ) g1
1 2 3 matrix([[180921.14457104, 33281.60801039, 22604.1908728 , 10412.0350517 , 3775.32504803, 10488.68941045, 4493.38109433]])
观察cost曲线,看看有没有收敛
1 2 3 4 5 6 t = np.linspace(0 , 1500 , 1500 ) plt.figure(figsize=(12 , 8 )) plt.plot(t, cost1, label='scatter' ) plt.xlabel('iters' ) plt.ylabel('cost' ) plt.show()
1 2 array([137944.88106755, 136222.15953388, 134542.47251256, ..., 27400.60027344, 27400.59914954, 27400.5980284 ])
五、做预测 1 2 data2 = test_data data2 = data2.loc[:, ['OverallQual' , 'GrLivArea' , 'GarageCars' , 'GarageArea' , 'TotalBsmtSF' , '1stFlrSF' ]]
1 2 tmp4 = data2.isnull().sum () tmp4[tmp4>0 ].sort_values(ascending=False )
1 2 3 4 TotalBsmtSF 1 GarageArea 1 GarageCars 1 dtype: int64
1 2 3 4 5 cols = ['TotalBsmtSF' , 'GarageArea' , 'GarageCars' ] for col in cols: data2[col].fillna(0 , inplace=True )
1 Series([], dtype: int64)
1 2 3 4 5 6 data2 = (data2 - data2.mean()) / data2.std() data2.insert(0 , 'Ones' , 1 ) cols = data2.shape[1 ] x2 = np.matrix(data2.values) y2 = x2 * g1.T y2
1 2 3 4 5 6 7 matrix([[115885.01852303], [167400.04822819], [160547.77546842], ..., [153666.34643612], [ 94793.69583206], [242838.70740226]])
1 2 3 4 df1 = pd.DataFrame(y2) tmp2 = df1.isnull().sum () tmp2
1 2 3 4 5 6 df = pd.DataFrame(y2) names=['SalePrice' ] df.columns = names test_data_output = pd.read_csv(test_path) df.insert(0 , 'Id' , test_data_output.iloc[:, 0 ]) df.to_csv("submission2.csv" , index=False , sep=',' )
六、在kaggle上提交


